It's you against the competition
If your BizCafe simulation's winning conditions are to make the biggest profit or have the most cash at the end of the game, you need to watch your cumulative net income as well as the competition's. Because we at Good Brews were behind by $439 after week 1, that meant that we would need to out-earn the 1st place team, Derosa Coffee House, by more than $439 in week 2 if we were going to catch up.
It's a game of out-playing the competition. I found that studying what the competition was up to went a long way towards developing an understanding of the game's dynamics (you can see what works and what doesn't), and it also drove the decisions we needed to make. There are elements of the simulation that depend on where your cafe stands in relation to the market. Wages definitely work like that--how much you pay your employees depends on what everyone else is paying. And the awards seem to work like that as well.
It's a game of out-playing the competition. I found that studying what the competition was up to went a long way towards developing an understanding of the game's dynamics (you can see what works and what doesn't), and it also drove the decisions we needed to make. There are elements of the simulation that depend on where your cafe stands in relation to the market. Wages definitely work like that--how much you pay your employees depends on what everyone else is paying. And the awards seem to work like that as well.
Read the numbers
This simulation is also a game of numbers. Whether it's about cash in the bank or a balanced scorecard, numbers are what tell you how your shop is doing. The numbers tell the story of what happened, and they point you towards what you need to fix in order to perform better the next week.
In the case of our week 1 results, these numbers in particular jumped out at me, because it's where we did worse than practically everyone else:
- 7th in revenue per employee - $341.41
- 8th in capacity utilization - 52.9%
Capacity is crucial
Here's why I wish I'd done the practice decisions with replays--I had no idea how many servers to hire. I knew that the team from winningatbizcafe.blogspot.com hired 9 servers, and that was too low. I was also told, in a tutorial where we did math exercises related to the game, that servers could serve 12 cups of coffee per hour. But I had no idea how much to expect in terms of first-week sales. We were given a sample of sales figures from an established shop, and based on that, I ended up arriving at a decision to hire 22 servers for the first week.
Well, we didn't need that many servers. I missed an important game component, the one that tells you how many servers you need. Under Decisions --> Staffing & Hours, the number at the far right is "Estimated Capacity". That's how many cups of coffee your servers can handle for the week. (Servers per hour is also important; I'll discuss that more later.)
Our capacity was 2,920. We sold 1,546 cups the first week, which works out to 52.9% of capacity. That means we were paying servers to be idle. That's also why our revenue per employee number was so low, despite being first overall in revenue.
In retail, your biggest expense is your staff. (If you treat them well, they're also your biggest asset!) You've got to find a balance that allows you to make the most revenue while minimizing wage expenses as much as possible. I'll discuss how we managed that in another post.
What happens if you don't play?
An interesting thing about us ranking 7th overall in revenue per employee: in our simulation, only four out of the eight coffee shops entered decisions for week 1. If you don't enter any decisions, the shop operates with the default decisions--including zero servers hired. That means the two managers serve the customers by themselves. The four shops that didn't play each ended up with the same figures: 410 cups sold, net loss of $2,207. Our first week net loss of $2,197 was only slightly better than that.
This is worth noting because a general principle of starting a business is that you will lose money at first. You need to build up a customer base and improve your profitability gradually. The sooner you start working towards being profitable, the sooner you get there. That difference is especially pronounced in a short, 8-week game like we played.
The four shops that didn't make decisions during week 1 never caught up. In an interesting twist, the team that finished in fifth place, with a cumulative net loss of $7,204, didn't play the game at all. They never entered any decisions. Yet, they still did better than the other three teams that missed week one. When I mentioned that to my instructor, he observed that sometimes the best decision is to not sink your money into a losing venture.
Applying our lessons learned
Anyway, back to our game...
So now, entering week 2, we had to figure out what kind of an increase in cup sales we could expect to see. I looked at other students' presentations (mostly on Prezi) to try to get an idea of what we could expect as a second-week increase. We knew we were going to have to reduce our staff in order to be more profitable than the first-place team.
We cut our staffing level from 22 servers to 14. Our total staff cost was reduced from $5,122.38 to $4,246.25. That included a $1.25/hour raise for servers, and a $35/week raise for managers.
And I noticed something interesting... During week 1, 22 servers making $0.50/hour above the average could handle 2,920 cups, or 13.3 cups per hour. Entering week 2, 15 servers making an additional $1.25/hour could handle 2,920 cups, or 19.0 cups per hour. I didn't compare to see if the wage increase made a difference, but it seems that the servers get better with experience.
The same thing happened from week 2 to week 3. 2 managers and 14 servers could handle 2,660 cups during week 2. Entering week 3, those same 2 managers and 14 servers could handle 3,260 cups, for a capacity of 23.3 cups per hour. This effect seemed to max out sometime after week 3.
The results, and a lesson about pricing
In week 2, we accomplished our goal--we out-earned Derosa Coffee House by $459, and pulled into first place in cumulative net income by $21.
But we didn't come close to hitting the sales target I had set. We had the smallest week-over-week increase in cups sold of any of the shops in our market (except the one that wasn't playing).
I wanted to figure out what happened. After looking at the numbers and the moves made by the other shops, I reviewed the notes that I took in class. There, I found some insights I had overlooked: "Good staffing can help you charge more," and "If you advertise well, you can charge more."
In week 1, we set our price ridiculously high--$5.30 for a medium cup. That was 80 cents higher than the next most expensive cup (Derosa). Because we did a lot of advertising, and had a high staffing level, we were able to sell a lot of cups (1,546, 2nd overall), and combined with our high price, that put us in first place in revenue. But when we cut our staffing level in week 2, that high price was less justifiable. As a result, the customers preferred our competition.
Another correction
So we needed to make some adjustments. Week 3 was the first week we were allowed to open on weekends, so we knew there would be a chance to increase sales. We cut our price from $5.30 to $5.00 for a medium cup. During week 2, we had a staffing level of 1.56 servers per hour, so we decided to maintain that, roughly. We hired 5 extra servers to cover the weekend, for 19 overall.
The result: We had our best week yet. Second in revenue, first in net income. We still trailed the other two most popular shops in terms of cups sold, but because we had much lower staffing expenses, we operated far more profitably.
Staffing level calculation
In the next post, I will explain how I used Excel to help make decisions, but for now, I want to point out one last thing regarding staffing level. In my zeal to understand how the BizCafe simulation worked, I wanted to figure out how some of the calculations were made. Servers per hour appears to be calculated like this:
# of servers x 10 hours/week / (Total hours open/week + (2 hours x # of days open))
Pretty simple--server hours divided by hours worked. (You need to account for an hour of prep before opening and an hour after close to shut down.) The weird thing I noticed, though, was that the numbers in the Staffing & Hours page were slightly different from the numbers I calculated.
Start: simulation calculation: 2.5; my calculation: 2.44
Period 1: simulation calculation: 1.6; my calculation: 1.56
Period 2: simulation calculation: 1.6; my calculation: 1.51
Period 3: simulation calculation: 1.8; my calculation: 1.67
Period 4: simulation calculation: 2.0; my calculation: 1.98
Period 5: simulation calculation: 2.2; my calculation: 2.14
Period 6: simulation calculation: 2.1; my calculation: 2.06
Period 7: simulation calculation: 2.3; my calculation: 2.22
Basically, the simulation always rounds up to the nearest tenth... Except for Period 3, where it rounded 1.67 up to 1.8. Why does this matter? Because I wanted to compare our staffing level with the competition's staffing level:
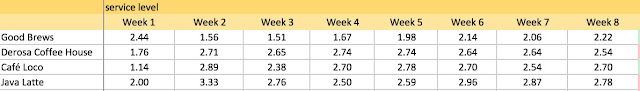
The only way to see the competition's staffing level is to calculate it yourself, so I went by my two-decimal-place calculations, and ignored the metric the simulation provided.
By the way, I had to guess at the number of servers employed by the other shops by assuming that the shops that opened for the whole weekend hired a third manager. Also, I couldn't tell which shops bought the oven, which requires an extra server to operate, so that's another thing to take into consideration.
This comparison ended up making a significant difference in how the game played out. Notice that in week 1, we had way more servers than everyone else. In week 2, we cut back, but the other shops appeared to copy our week 1 strategy (possibly because we came in first in revenue), and hired even more staff than we had during week 1. Even as we gradually increased our service level up to 2.22 servers per hour, that was still far less than our competition.
We played a good game, but the competition's overstaffing really helped us out. We pulled ahead in week 2, and stayed ahead the rest of the way.
No comments:
Post a Comment
Comments are subject to approval. I've worked in SEO, so I know a real comment from spam. Thanks for NOT trying spam comments here.