Monday, April 23, 2018

Introduction: How we won BizCafe

If you came across this blog, I'm assuming you're a college student who is taking a class where you're playing the BizCafe simulation game as an exercise in running a business. I'm a software development student, and for our Business Fundamentals course, we spent eight weeks playing BizCafe.


The sweet taste of victory

That's us at the top--Good Brews
I'm pleased to report that we were the winning team. There were, I'm guessing, three tutorial sections in the class, each with eight cafes competing against each other. Not only did we win our section, but we were the top-earning cafe in the whole class, and by a wide margin--the professor said we won by about $10,000. (Our final lead in cumulative net income was $7,653.)

The term is over, but I wanted to create this blog to share tips on how to win at BizCafe while the experience was still fresh in my mind. We had an incentive to win--the winning team would receive a 5% bonus in their grades for the course. I put in a ton of work to figure out how the game worked and to make informed decisions, so I wanted to pass on what I learned and leave behind a record of my efforts.


Each game is different

Some qualifications to start... Based on the many presentations and blogs that students have created to share their experiences with the game, it would appear that the gameplay is different in each instance.  There appear to be some features common to every game, but it's good to be prepared for a range of eventualities. 

The length of the game can vary, and this will affect how you play. According to the game's documentation, the simulation can last up to 16 weeks. Ours lasted 8 weeks. I can only presume that many of the principles I discuss here will apply to a longer game, but I found that the number of weeks left in the game is a serious consideration. Any decision that involves a cash outlay followed by potential long-term benefits must be made in the context of how much time you have left. It's a waste of money to sink cash into your shop if there's only one week left.


Do your research

If you want to do well at this game, the first thing you should do, if you haven't done so already, is visit How to Win BizCafe Simulation at http://winningatbizcafe.blogspot.com/, and read it all the way through. I did, and I adopted many of their suggestions, which I will detail in the next post. Also, read the documentation that comes with the game. It's a pdf file that's about thirty pages long, but it's worth it. Myself--I read every single presentation on the game that was out there, but the only value I got from those was to get a sense of the possible special decisions and incidents we would potentially encounter; I didn't find much about gameplay.

The week before our game started, our professor explained some of the game dynamics. If your instructor does this--take notes! I did, and they came in handy later when I needed to investigate why our projections didn't work out. Here's what I wrote down. The arrow, "-->" means "drives".
  • Five decisions you need to make every week: price, advertising, staffing, wages, and supplies
  • Revenue - Expenses = Profit
  • Sales Volume * Price --> Revenue
    • Volume is affected by price
  • Advertising --> volume --> expenses
    • If you advertise well, you can charge more
  • Supplies --> expenses
    • Supplies can affect volume if you get it wrong
  • Staffing --> expenses --> volume
    • Good staffing can help you charge more
  • Wages --> expenses --> volume --> price
    • Happy employees can better serve customers
  • Furniture -- do you want to be Starbucks or Coffee Time?
  • Equipment -- small espresso maker or large?
  • Each week: decisions for the week:
    • Quantity and quality of coffee
    • Hours to open
    • Advertising/promotion
      • Online
      • Radio
    • Product price
    • Special decisions
  • Reports to use:
    • Decision Summary, Cash-Budget Analysis, and Break-Even Worksheet for making weekly decisions
    • Under "Company": check book, daily receipts, income statement, balance sheet, cash flow statement
    • Market: local labor report
    • Recommended: Use a spreadsheet to calculate and forecast

What we learned from winningatbizcafe.blogspot.com

Important thing to do before you start playing BizCafe: learn from the team who wrote http://winningatbizcafe.blogspot.com/. Read it in its entirety if you haven't done so already.

I want to make an important distinction--in the BizCafe game described at winningatbizcafe.blogspot.com, their winning conditions involved earning the highest score on a balanced scorecard. In our game, the winner was determined by which team had the most cash in the bank at the end of the game. This may influence how you need to play. I have no idea how their balanced scorecard was calculated, but the game dynamics they described applied well to our situation, and helped us to run a very profitable shop.

Here are the major strategy points we adopted from this site:
  • Go with the high-capacity espresso maker
  • Avoid the cheaper, used furniture
  • Keep wages above industry average and raise them as the average increases
  • Start with higher prices and adjust downward
  • Buy the cups at the maximum bulk level, and pay less per cup
  • Don't bother with coupons
  • Maximize hours
  • Ordering too much coffee is more expensive than ordering too little
  • Buy the insurance for period 1's special decision
  • Higher price, highest quality coffee, maximize customer satisfaction
  • Pay your managers generously
  • Raise brand awareness quickly by advertising heavily
  • Read the other cafes' menus; pay attention to local labor market figures
  • Pay attention to the results page
They also recommended investing in the more detailed customer survey when it becomes available. That option didn't come up in our game.

In their game, there was a fire, and if you didn't buy the insurance, you had to replace your espresso maker. That didn't happen in our game, but I still feel buying the insurance is the better decision.

One thing about raising prices versus lowering prices... I had good results from reducing prices and boosting sales. But I also saw instances in our simulation where shops raised their prices and it didn't hurt sales. So don't be afraid to raise prices if you need to. Just make sure you're advertising and you have enough servers.

Premium strategy and the importance of a strong start


Elegant furniture at Good Brews
Our general strategy: We'd rather be Starbucks than Coffee Time. That means spending money to make money. Premium offerings at a premium price.

A caveat about this blog--there very well could be other decisions and strategies that are effective in this game. I have no idea if it's possible to run a bargain-basement coffee shop and be as profitable as we were. It very well could be. But because we followed this strategy from the start, it's the only one I know worked. There are some areas in the game where you can adjust your strategies, change tactics and compare the results, but there are some where you have to choose a road to follow, and you don't get to explore the road not taken.

I'll say this much, though--in our game, the teams that went up-market and charged premium prices sold more cups and earned far more revenue than the teams that went down-market.


Start strong to finish strong

Cumulative net income for the top 4 teams in our game.
The top two teams did $2k better in week 1 net income.
That gap just got wider.
Your startup decisions are very important. Especially in an 8-week game--it's a sprint. If you stumble out of the starting block, and another team has a better plan and gets off to a good start, there's a good chance you'll never catch up.

In our market, there were two shops that did significantly better than the rest during week 1 (we were one of them), and from then on, it was a two-horse race. The third-place team finished week 1 $2,800 behind. That means they would have needed to out-earn the first-place team by $2,800 the next week to catch up.

If you're not out-earning the first place team, you're falling farther behind.

Good teams learn from their mistakes, and therefore continuously improve. I'm also guessing that there are customer loyalty and word-of-mouth factors built into the simulation, possibly a function of brand awareness and customer satisfaction. This rewards the successful teams; the rich get richer. So it's very important to start strong.


Branding

Now, in our game, it didn't end up mattering what you named your shop, or if you made a logo and created ads, but I didn't know this at the start, so I figured: if the game gives you the option of doing it, do it. You never know what matters. Following are the logo (two variations), cup design, and ad I created.

Given that this game is played in business classes, you're probably going to get a better grade if you take branding seriously. In my class, at the end of the semester, we had to do Dragon's Den-style pitches, asking for investment in our business, and it helped my pitch to show that I had thoughtfully created a brand image that suited our offerings. Also, there was an award for the team who created the best logo (another team won that). So I'm glad I invested a few hours in developing creative.

(Image credits:

Lessons from weeks 1 and 2: Capacity utilization and price

Our week 1 dashboard results
In our class, there was a period where you could make practice decisions, and do three replays to see how different decisions played out. I didn't pay for the simulation and get together with my group until after this practice period was over. As a result, we had to make mistakes and learn from them during the live game. We were damn lucky that we were able to get out from the hole we dug ourselves in week 1. If you have the opportunity to make practice decisions--use it!


It's you against the competition

If your BizCafe simulation's winning conditions are to make the biggest profit or have the most cash at the end of the game, you need to watch your cumulative net income as well as the competition's. Because we at Good Brews were behind by $439 after week 1, that meant that we would need to out-earn the 1st place team, Derosa Coffee House, by more than $439 in week 2 if we were going to catch up.

It's a game of out-playing the competition. I found that studying what the competition was up to went a long way towards developing an understanding of the game's dynamics (you can see what works and what doesn't), and it also drove the decisions we needed to make. There are elements of the simulation that depend on where your cafe stands in relation to the market. Wages definitely work like that--how much you pay your employees depends on what everyone else is paying. And the awards seem to work like that as well.


Read the numbers

This simulation is also a game of numbers. Whether it's about cash in the bank or a balanced scorecard, numbers are what tell you how your shop is doing. The numbers tell the story of what happened, and they point you towards what you need to fix in order to perform better the next week.

In the case of our week 1 results, these numbers in particular jumped out at me, because it's where we did worse than practically everyone else:
  • 7th in revenue per employee - $341.41
  • 8th in capacity utilization - 52.9%

Capacity is crucial

Here's why I wish I'd done the practice decisions with replays--I had no idea how many servers to hire. I knew that the team from winningatbizcafe.blogspot.com hired 9 servers, and that was too low. I was also told, in a tutorial where we did math exercises related to the game, that servers could serve 12 cups of coffee per hour. But I had no idea how much to expect in terms of first-week sales. We were given a sample of sales figures from an established shop, and based on that, I ended up arriving at a decision to hire 22 servers for the first week.


Well, we didn't need that many servers. I missed an important game component, the one that tells you how many servers you need. Under Decisions --> Staffing & Hours, the number at the far right is "Estimated Capacity". That's how many cups of coffee your servers can handle for the week. (Servers per hour is also important; I'll discuss that more later.)

Our capacity was 2,920. We sold 1,546 cups the first week, which works out to 52.9% of capacity. That means we were paying servers to be idle. That's also why our revenue per employee number was so low, despite being first overall in revenue.

In retail, your biggest expense is your staff. (If you treat them well, they're also your biggest asset!) You've got to find a balance that allows you to make the most revenue while minimizing wage expenses as much as possible. I'll discuss how we managed that in another post.


What happens if you don't play?

An interesting thing about us ranking 7th overall in revenue per employee: in our simulation, only four out of the eight coffee shops entered decisions for week 1. If you don't enter any decisions, the shop operates with the default decisions--including zero servers hired. That means the two managers serve the customers by themselves. The four shops that didn't play each ended up with the same figures: 410 cups sold, net loss of $2,207. Our first week net loss of $2,197 was only slightly better than that.

This is worth noting because a general principle of starting a business is that you will lose money at first. You need to build up a customer base and improve your profitability gradually.  The sooner you start working towards being profitable, the sooner you get there. That difference is especially pronounced in a short, 8-week game like we played.

Final cumulative
net income figures
The four shops that didn't make decisions during week 1 never caught up. In an interesting twist, the team that finished in fifth place, with a cumulative net loss of $7,204, didn't play the game at all. They never entered any decisions. Yet, they still did better than the other three teams that missed week one. When I mentioned that to my instructor, he observed that sometimes the best decision is to not sink your money into a losing venture.


Applying our lessons learned

Anyway, back to our game...

So now, entering week 2, we had to figure out what kind of an increase in cup sales we could expect to see. I looked at other students' presentations (mostly on Prezi) to try to get an idea of what we could expect as a second-week increase. We knew we were going to have to reduce our staff in order to be more profitable than the first-place team.

We cut our staffing level from 22 servers to 14. Our total staff cost was reduced from $5,122.38 to $4,246.25. That included a $1.25/hour raise for servers, and a $35/week raise for managers.

And I noticed something interesting... During week 1, 22 servers making $0.50/hour above the average could handle 2,920 cups, or 13.3 cups per hour. Entering week 2, 15 servers making an additional $1.25/hour could handle 2,920 cups, or 19.0 cups per hour. I didn't compare to see if the wage increase made a difference, but it seems that the servers get better with experience.

The same thing happened from week 2 to week 3. 2 managers and 14 servers could handle 2,660 cups during week 2. Entering week 3, those same 2 managers and 14 servers could handle 3,260 cups, for a capacity of 23.3 cups per hour. This effect seemed to max out sometime after week 3.


The results, and a lesson about pricing

All the other shops had bigger
increases in cups sold! Not good.
In week 2, we accomplished our goal--we out-earned Derosa Coffee House by $459, and pulled into first place in cumulative net income by $21.

But we didn't come close to hitting the sales target I had set. We had the smallest week-over-week increase in cups sold of any of the shops in our market (except the one that wasn't playing).

I wanted to figure out what happened. After looking at the numbers and the moves made by the other shops, I reviewed the notes that I took in class. There, I found some insights I had overlooked: "Good staffing can help you charge more," and "If you advertise well, you can charge more."

In week 1, we set our price ridiculously high--$5.30 for a medium cup. That was 80 cents higher than the next most expensive cup (Derosa). Because we did a lot of advertising, and had a high staffing level, we were able to sell a lot of cups (1,546, 2nd overall), and combined with our high price, that put us in first place in revenue. But when we cut our staffing level in week 2, that high price was less justifiable. As a result, the customers preferred our competition.


Another correction

So we needed to make some adjustments. Week 3 was the first week we were allowed to open on weekends, so we knew there would be a chance to increase sales. We cut our price from $5.30 to $5.00 for a medium cup. During week 2, we had a staffing level of 1.56 servers per hour, so we decided to maintain that, roughly. We hired 5 extra servers to cover the weekend, for 19 overall.

The result: We had our best week yet. Second in revenue, first in net income. We still trailed the other two most popular shops in terms of cups sold, but because we had much lower staffing expenses, we operated far more profitably.
Week 3 results. We had our best week, and pulled out in front by $1,522.

Staffing level calculation

In the next post, I will explain how I used Excel to help make decisions, but for now, I want to point out one last thing regarding staffing level. In my zeal to understand how the BizCafe simulation worked, I wanted to figure out how some of the calculations were made. Servers per hour appears to be calculated like this:

# of servers x 10 hours/week / (Total hours open/week + (2 hours x # of days open))

Pretty simple--server hours divided by hours worked. (You need to account for an hour of prep before opening and an hour after close to shut down.) The weird thing I noticed, though, was that the numbers in the Staffing & Hours page were slightly different from the numbers I calculated.

Start: simulation calculation: 2.5; my calculation: 2.44
Period 1: simulation calculation: 1.6; my calculation: 1.56
Period 2: simulation calculation: 1.6; my calculation: 1.51
Period 3: simulation calculation: 1.8; my calculation: 1.67
Period 4: simulation calculation: 2.0; my calculation: 1.98
Period 5: simulation calculation: 2.2; my calculation: 2.14
Period 6: simulation calculation: 2.1; my calculation: 2.06
Period 7: simulation calculation: 2.3; my calculation: 2.22

Basically, the simulation always rounds up to the nearest tenth... Except for Period 3, where it rounded 1.67 up to 1.8. Why does this matter? Because I wanted to compare our staffing level with the competition's staffing level:

The only way to see the competition's staffing level is to calculate it yourself, so I went by my two-decimal-place calculations, and ignored the metric the simulation provided.

By the way, I had to guess at the number of servers employed by the other shops by assuming that the shops that opened for the whole weekend hired a third manager. Also, I couldn't tell which shops bought the oven, which requires an extra server to operate, so that's another thing to take into consideration.

This comparison ended up making a significant difference in how the game played out. Notice that in week 1, we had way more servers than everyone else. In week 2, we cut back, but the other shops appeared to copy our week 1 strategy (possibly because we came in first in revenue), and hired even more staff than we had during week 1. Even as we gradually increased our service level up to 2.22 servers per hour, that was still far less than our competition.

We played a good game, but the competition's overstaffing really helped us out. We pulled ahead in week 2, and stayed ahead the rest of the way.

Using Excel to support decision making

My BizCafe workbook. A labor of love.
I must admit--I love Excel. I don't say that about many things, but since I learned how to use Excel in a college class many years ago, I find it incredibly satisfying to use Excel to work with data. Odds are you won't be as intrinsically motivated to do all this work as I was, but I wanted to make informed decisions.

In the tutorial class where we were briefed on the game, our professor recommended using a spreadsheet to help with making decisions. The reports that BizCafe offers provide all the information you'll need, but to harness that data and make projections, I found that Excel made it easier to organize my thinking.

By week 3, I had my basic decision-making process figured out. In this post, I'll walk through that process. There are lots of ways to do this, I'm sure, and I wouldn't expect anyone to put in as much work as I did, but this is what worked for me.


Competition tracking

The purpose of competition tracking, for me, was to get a handle on how each team was performing and understand what was working and not working.

I started using Excel to track the competition after week 2. I wanted to compare how each team did from week to week. I pulled data from the results page, and added it to my spreadsheet:

I took the cups sold data and the customer satisfaction data from the results page outside the simulation, and the price, hours, and employees figures from the Market section of the simulation. I like using conditional formatting to highlight the "difference" column, so I can easily see which numbers went up and which numbers went down from week to week.

(You know, eventually, I'd love to develop the programming acumen to be able to automate this process, but I did this all manually. I also enjoy data entry in a way most people don't.)

After week 2, I gave this section its own worksheet in my workbook. I continued to add each week's data so I could see the new week-over-week changes, and I expanded my tracking to cover the following metrics:
  • Cups sold
  • Price
  • # of employees
  • Hours open
  • Staffing level (calculating this necessitated tracking # of employees and hours)
  • Customer satisfaction
  • Brand awareness
  • Net income
  • Cumulative net income
  • Revenue
  • Revenue per employee
You should know--I didn't actually "use" all of this data. But I wanted to have it handy just in case I needed it for whatever reason later. And the act of copying it down forced me to take note of what was happening in the game. Here are two things that I found particularly useful from this table:

1. Industry total of cup sales


This was useful for making sales projections from week to week. From studying presentations I'd found online, I knew that total cup sales increased at first, but then levelled off.
  • Week 2--increase of 3,909 as the shops' brand awareness grows
  • Week 3--increase of 4,568 as shops open for the weekend
  • Week 4--even though brand awareness continues to rise, total cup sales only grow by 910
  • Weeks 5 and 6--increases of 1,116 and 264--more levelling
  • Week 7--increase of 1,088 as shops offer small and large sizes for the first time
  • Week 8--contraction for the first time (there's a particular reason that happened)
I tracked this because I wanted to see if there is some point where market saturation occurs, after which your success becomes a matter of "stealing" business from your competitors. I have a feeling that this is more likely in a longer game.

One very useful bit of information I gleaned from this was the impact of brand awareness. I'll discuss this in another post, where I explain my advertising and promotion strategy.

2. Staffing levels for each shop

I explained this in the previous post, "Lessons from weeks 1 and 2: Capacity utilization and price". This is where I pulled that information from. You get the number of employees from the Market > Local Labor report. Hours data come from the Market > Industry Menus.

"Hours" was kind of a pain in the ass. For the shops that were open 7 days a week, 7 to 11, that was easy--112 hours. For the others, I used a formula that looked like this:

=(22-7)*5+(23-8)+(21-8)

(22-7) represents 10pm minus 7am, the shop's weekday hours, which are multiplied by 5. The other two parentheses represent Saturday and Sunday hours.

This is where copying cells comes in handy. Once I created this formula, I would copy it to the next cell and tweak the numbers. When the next week came around, I would copy the previous week's cells, paste them in the new week's column, and check the menus to see if anything needed to be changed. I found that there were usually only a few changes to hours each week.


Factors affecting sales volume (optional, maybe read this, but don't bother doing it unless you're really ambitious)

This part takes more work than I'd expect your average college student to put in. At the end of this post, I'll explain some Excel tricks that make work like this manageable. The value of this probably isn't worth the effort for most people. I wanted to see if there were any discernible patterns among these factors.

After week 4, I think it was, we were given an in-class assignment where we needed to do pricing/revenue projections based on the game. Part of the assignment was to hand in a price/sales/revenue projection model, where you would make revenue projections based on projected sales levels at a range of price points. It was a simple economic model--lower price, more sales; higher price, lower sales; from this, find the combination that yields the most revenue.

But I knew it wasn't that simple. Your sales weren't simply a function of your price. By that point, I knew there was an interplay of four main factors that influenced your sales volume:
  • Price
  • Brand awareness
  • Servers/hour
  • Customer satisfaction
Furthermore, I had a suspicion that the relative values of these factors could be as significant as the absolute value of these factors. So I was inspired to do the following:
  1. Calculate the industry average of each of these factors, plus sales volume, for each week.
  2. Create a table for each shop where each absolute value for each of these factors is converted into a relative, indexed value, where 100 represents the industry average.
    • A value higher than 100 means your shop was above average for that metric.
    • A value lower than 100 means your shop was below average for that metric.
    • For example, during week 1, our price was $5.30. The average price was $4.32. 
      • 5.30 divided by 4.32 times 100 equals an indexed price of 123.
  3. Between each week, I included a condition-formatted "weekly difference" column, to display where increases and decreases were happening.
  4. I constructed a line chart that overlaid the four factors plus sales volume, and put it side-by-side with a graph showing revenue and net income.
This is what my "index table" looked like after eight weeks:

And these were our final charts:

The meaning of what you see in these charts would be different in every game, because they represent the unique industry conditions of your game. For example, our relative "Servers/Hour" metric was so low because other shops went overboard on staffing. In that case, indexing below the average was the better strategy.

I did this for our shop, and for all the shops in the game. Again, most of the data didn't turn out to be all that interesting. But it all told a story.

All in all, though--this step is optional. I did it out of curiosity.


My decision-making process

I did the competition analysis described above so I could get an idea of who was doing what, and why some shops were successful and some weren't. Most importantly, after the three weeks when Derosa Coffee House out-earned us, or the weeks where our sales results didn't meet our projections, I wanted to find out how and why that happened.

Once I had a picture of what happened and what needed to be done to fix it, I started work on my decisions. I worked out this process after week 2. It's not a straight, linear process; there's some back-and-forth and a lot of tweaking involved.

1. Daily sales records and forecast

I created a separate worksheet within the workbook called "DailySales".

Under Company, I opened Daily Receipts. From this table, I would enter daily capacity and cups served for the day. I opened each day's report and pulled Long Wait, Served After Hours, and Left or Outside Hours. I compiled them into daily tables like this:

After week 2, I was able to plot the Week to Week Cups+ column:

Bottom status bar displays average, count, and sum of
selected data.
With that column, I got a sense of how much sales were increasing on a day to day basis. Then, based on these numbers, I would make projections for the coming week.

Here's a handy Excel trick: if you select a group of cells, the status bar at the bottom of the window shows the average, count, and sum of the data in those cells.

I would select the five weekdays and find the average increase from the week before. Then, for the following week, I would make a conservative estimate of what kind of increase I would expect to see. So in the upper block of numbers in the image above and to the right, Week to Week Cups+ is a calculation. In the lower block of numbers, the Week to Week Cups+ values (the 30s and 10s) are entered into the cell, and the values in the Cups Served column are a calculation: last week's sales plus the estimated increase for that day.

Note that it is necessary to do separate calculations and projections for Saturdays and Sundays. Saturday sales are less than weekdays, and Sunday sales are less than that.

For the capacity numbers, I would start out with capacity numbers based on the same number of servers as the week before. Later in the process, when I would have to decide how many servers to employ, I would come back and tweak these numbers.

Another good thing to do at this stage is to look at how many customers were lost the previous week because of long lines or inadequate hours:

Lost revenue is the number of customers who left times the revenue they would have generated.
  • At first, that's pretty simple: Left or Outside Hours x Price
  • After you add the baked goods: Left or Outside Hours x Price + Left or Outside Hours x 0.3 x Baked Goods Profit Margin ($1.50 or $1.00 if you didn't buy the oven)
  • After you add small and large sizes: Left or Outside Hours x Small % of Sales x Small Price + Left or Outside Hours x Medium % of Sales x Medium Price + Left or Outside Hours x Large % of Sales x Large Price + Left or Outside Hours x 0.3 x Baked Goods Profit Margin
It's important to note the sum of these daily values--the total revenue lost for the week. This needs to be taken into consideration when determining how many servers to hire for the following week. The incremental cost of an additional server can be worth it if it reduces your lost revenue significantly.

Notice here that the capacity utilization numbers were higher during week 8 than they were during week 7, when we had more customers leave the shop due to long lines. There were more customers complaining about a long wait during week 8, but they stuck around instead of leaving.

2. Set wages

I set wages for managers and servers based on the industry averages. The higher your managers' and servers' pay is compared to the industry average, the more satisfied they'll be, and the more satisfied your customers will be.

I found it necessary to keep the difference at least the same, or greater than previous weeks. There was one week where I tried leaving wages the same while the industry average went up, and I had a server quit. That was the first time that happened. The relative raises returned the following week.

3. Set number of servers/capacity

Next, I would figure out the cost of the various staffing levels I could set. These next two images are all the same rows; I split them in two because it's too long for the screen otherwise.


In this example, I wanted to consider the cost and capacity of 21 through 25 servers, and figure out the additional cost involved in each staffing level compared to the previous week. I would factor in the rise in wages in the "manager cost" and "server cost" columns--simply the number of each times the wages of each. I would use the Decisions > Staffing & Hours window to get the capacity and servers per hour numbers. Payroll taxes, at least in my simulation, I figured out to be 7.5% of the staff cost.

I would look at the sales increase I hoped to see (as calculated in "DailySales") and make sure that the capacities of the staffing levels I was considering were adequate to cover it. Next up--plug the staffing costs into net income projections.

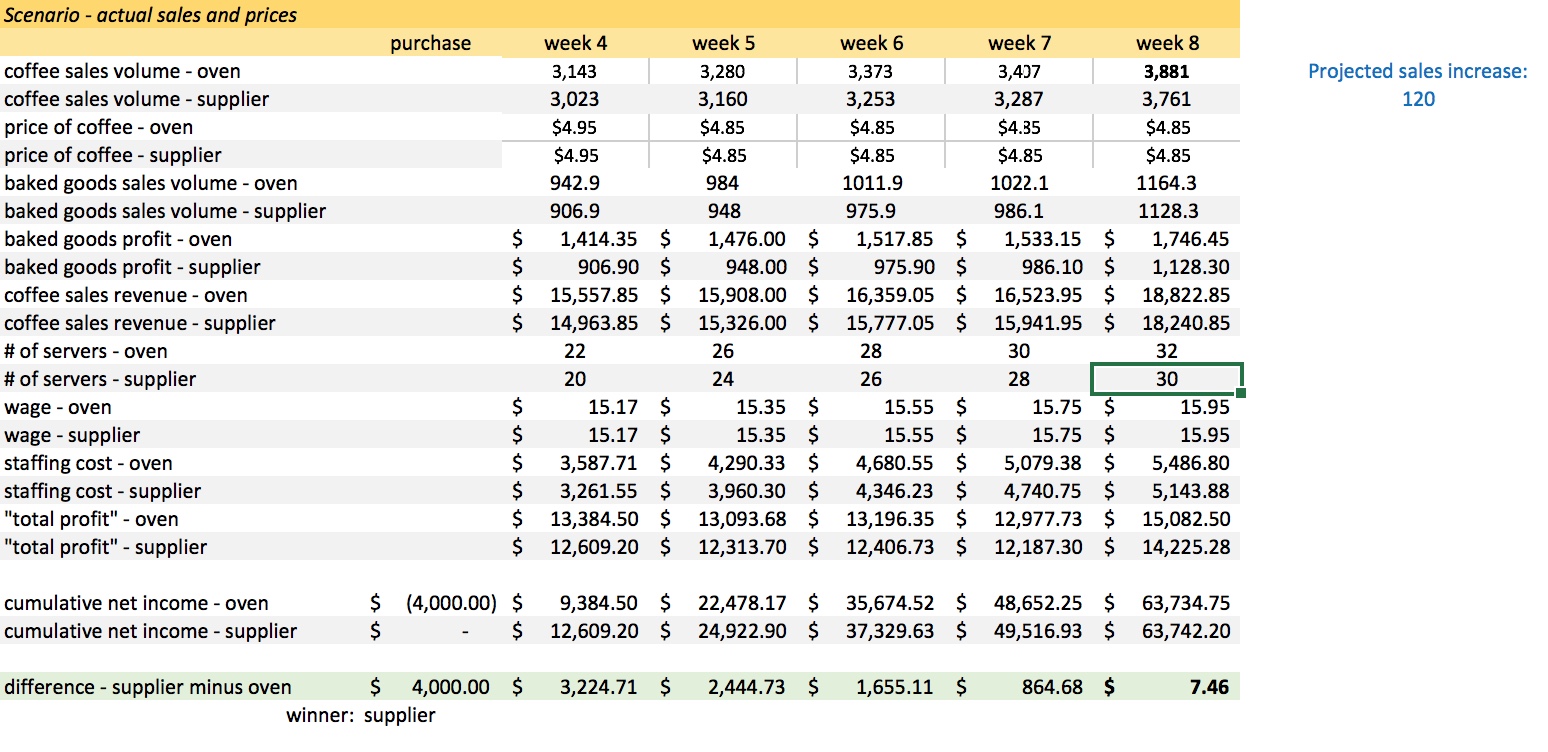
4. Net income projections

Here's the framework I used to project net income for the week:

This one was from a week after we had added baked goods, but before we offered medium and large sizes. I would use relative cell references in the formulas so that I could copy the whole thing; I would create one of these for each combination of staffing level and price that I was considering. Here's another one from the same week:

The green highlight indicates that this was the decision I went with--25 servers, $4.85 for a medium cup.

Here's what the revenue projections looked like after we had the option of offering small, medium and large sizes:

The columns to the right of the box on the left represent the different levels of profitability I could expect from the different possible sales volumes that could happen. I used conditional formatting again--the green volumes are those which were above the projection I calculated in the "DailySales" worksheet; the red volumes are below the projection.

Week 2: Inhibited sales growth, but improved profitability
After the first two rounds, I decided it was useless to try to assume I knew what the sales would be for the coming week, even though you need to make a guess so you can buy an appropriate amount of coffee. I wanted to see the range of potential incomes that were possible--if I was satisfied with the potential incomes we could see at that combination of servers and price, that's what mattered. During week 2, cup sales were way under our sales estimate, by 227 cups. But we still turned a bigger profit than the other shops. I had accounted for that sales level in the range of net income projections.

5. Settling on decisions

There weren't any hard-and-fast rules I used to pick a combination of servers and price. Usually it was a response to the analysis from the week before. If we dropped the price, we could expect more customers wanting to buy the coffee, but that would mean we needed to add more servers to handle the increased demand.

After we bought the oven, we didn't add enough servers to accommodate the increased demand, and that hurt our sales growth that week. That showed up as an increase in the number of customers who left the shop due to a long wait, and a relatively small increase in sales compared to the competition.

So there's an element of guesswork involved that you can't avoid. The general guidelines I would try to abide by were:
  • Find the problems and make decisions that solve them
  • Err on the side of profitability
So we'd skimp on servers, or leave our price high, and then make corrections when we saw that we were holding back potential sales gains (like after week 2).

Cash budget analysis from the week we bought the oven.
It was the same week we had to pay taxes. Actual decrease in cash
wasn't as bad as this; turned out to be $2,495.53.
Note the box at the bottom of the income projection--that's the change in cash that the simulation projected. I would enter the potential decisions in the Staffing & Hours and Marketing pages in the simulation, and then check the Cash Budget Analysis page to see what the projected change in cash would be. That's important to keep an eye on. Taxes are paid on the fourth week of every month, and the oven purchase shows up here, but not on the income statement, because it's a capital expense, and not an operating expense.

One thing to note about that cash projection--it doesn't include revenue from baked goods. I had to add that calculation myself.


Organizing my workbook

So far, I've discussed the three main worksheets I would use to make decisions: "Competition", "DailySales", and the decision-making worksheet, which I called "MainWeek2toWeek3". I created a new decision-making worksheet each week, e.g. "MainWeek3toWeek4", etc., by duplicating the previous week's sheet and updating the values.

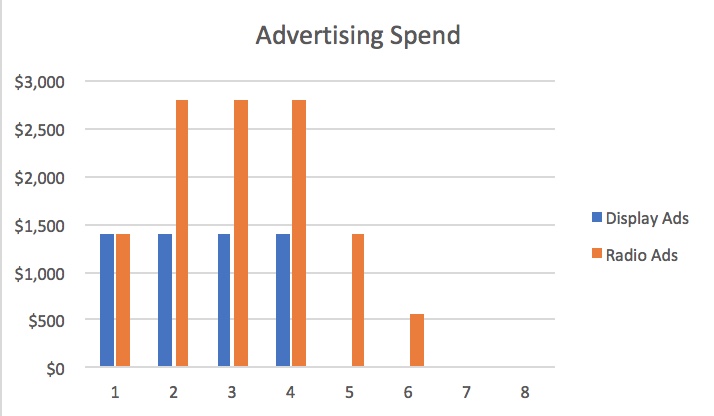
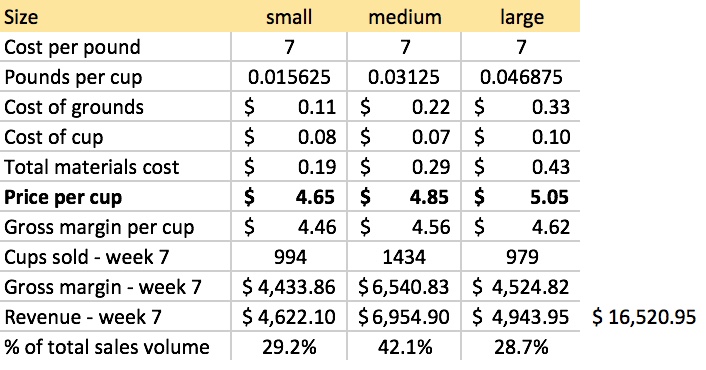
I also had a separate worksheet called "BrandAwareness", which I used to make decisions about advertising spend; one called "OvenDecision", which I used to figure out whether or not to buy the oven; and one called "SmMdLg", where I analyzed the small-medium-large pricing decisions. I will be writing separate posts for each of these topics.


Excel techniques that helped

A big one--copying and pasting formulas. Practically every screenshot in this post shows a table where I would plot out one row of data, copy and paste that row, and then change the necessary values in the new row.

This table used all the techniques I've mentioned
A necessary concept to have mastered to facilitate this technique is using absolute and relative cell references: Switch between relative, absolute, and mixed references

Another one: Use formulas with conditional formatting

I'm also a big fan of customized number formatting: Create or delete a custom number format

Also useful to know how to freeze panes: Freeze panes to lock rows and columns

The BizCafe baked goods decision

The baked goods special decision
The baked goods decision in BizCafe came along for us after period 3. You know that 30% of your customers will buy baked goods. You have three options:
  • Purchase an oven to make baked goods in the shop
  • Buy baked goods from a local bakery
  • Do nothing
First of all, doing nothing is the worst option. You'd be passing up the opportunity to add a revenue stream with no risk of a loss. There are no benefits from that, so don't even consider it.


The options

So you really have two options. Either way, you sell the baked goods for $2.00 at a rate of 30% of your coffee cup sales.
  • Buy the oven
    • Initial outlay of $4,000
    • Cost per baked good: $0.50
    • Must hire an additional employee to work the oven
    • Smell of baked goods improves the ambience of your cafe, which attracts customers and increases cup sales
  • Buy baked goods from a local bakery
    • Cost per baked good: $1.00
I was not satisfied with the calculation method presented in the game, nor with any of the calculations I found in the reports on the internet, so I figured it out for myself.


A screen capture from the video on the Special Decision page
Time remaining is crucial

First, you know that if you buy the oven, you're digging yourself a $4,000 hole compared to going with the supplier. So the question is--when you look at the other factors, what happens? You make more profit per baked good with the oven, you sell more coffee with the oven, but you have to pay an additional employee. Will the benefits be enough to make up for the $4,000 outlay? The supplier is the safer route; the oven is the risky route.

I don't know how this played out in other simulations, but in our game, there were five periods after week 3 to earn revenue from baked goods. When I did my first set of projections, I discovered that having five weeks left made the decision especially difficult:
  • After four weeks, it's not worth buying the oven
  • After six weeks, it's definitely worth buying the oven
  • After five weeks, it depends!
What it depends on is this: How big of a sales increase will you get from the improved ambience in your cafe? With my first projection, I determined:
  • If you get an increase in coffee sales of more than 88 cups per week from the improved ambience, then it's worth buying the oven
  • If you get an increase in coffee sales of 88 cups or less per week, then it's not worth it


    The kicker--you have no way of knowing just how much of an increase you get from the improved ambience.

    Here's how to make the calculations. You need to account for each of these factors, and run the numbers both ways, oven vs. supplier, then plot them out for each of the remaining weeks:
    • Coffee sales volume
      • Will be higher with the oven, but you don't know how much
    • Price of coffee
    • Baked goods sales volume
      • 30% of coffee sales volume either way
      • Will be higher with the oven because your coffee sales will be higher
    • Baked goods profit
      • $1.00 per baked good with the supplier
      • $1.50 per baked good with the oven
    • Coffee sales revenue
      • Will be higher with the oven
    • Number of servers
      • Will be one more with the oven than supplier
    • Wages
    • Staffing cost
      • Will be higher with the oven by the cost of one server per week
    • "Total profit"
      • Your revenue from coffee and baked goods sales, minus the staffing cost
    With "Cumulative net income", you start $4,000 in the hole with the oven; you start at $0 with the supplier. Then, for each week, you add that week's "total profit" to your running totals.

    The bottom row subtracts the difference between the two scenarios. As you can see in the graphic above, the difference between the two scenarios starts out in favour of the supplier, but diminishes with each passing week, because the additional coffee sales and better margins on baked goods that come with buying the oven outweigh the added cost of additional server. (By the way, the cell next to the "winner:" cell uses an IF function to return "supplier" if the difference is greater than zero, "oven" if the difference is less than zero. Another fun Excel technique!) 


    Why the 88-cup difference makes the difference
    The sales boost from the oven

    I kept coffee price and server wages the same for both options. Then I adjusted the difference between the coffee sales volumes to see how the numbers played out. (To make that easier, I created a cell that contained a value for the difference, plotted out the sales volume for the supplier, then for the oven value I used a formula that added the difference to the sales volume for the supplier for each week.)

    The greater the boost in sales, the more it favours buying the oven. Based on my first calculation, with each additional cup sold, it tilts the choice in favour of buying the oven by $26.20. All other factors equal, projecting a moderate increase in sales with an 88-cup difference between the two options, you'd be $5.93 more profitable if you used the supplier.


    However... I copied these cells, and ran another projection. How do the numbers play out if there is a greater increase in sales over the subsequent five weeks compared to the initial scenario?

    So here, the 88-cup difference yields a $102.07 benefit if you buy the oven! An 84-cup difference was the threshold between the two options in this scenario. I ran it again with even higher demand, and the threshold was reduced to a 77-cup difference.

    I also ran a bunch of scenarios where I compared coffee price differences. The general trend I found was that if you bought the oven, and kept your coffee price higher than you would have had you used the supplier, this tilted things in favour of buying the oven.


    So what do you do?

    It's a tough call. A lot of it depends on the situation in your particular game. Once the game was over, I went back to my "OvenDecision" worksheet, and plugged in the actual sales figures and prices that we used over the last five weeks of the game. What did I see? 

    The 88-cup difference, spot-on. If our actual sales were more than 88 cups per week higher because of our improved ambience, then it was worth it to buy the oven. Our actual sales ended up roughly matching my initial projection. 

    The thing is, once you choose one path, you have no way of knowing how things would have turned out had you chosen the other path. You live with your choice.

    We kept our Best Ambience award!
    In our case, it came down to three things, not related to the projections:
    • My father once told me that he had a tennis coach who said that when you're winning, you can take risks, but when you're behind, you have to play conservatively. We were ahead in cumulative net income by $1,522 at that point. In most of the scenarios I ran, the differences between the two options swung by a few hundred dollars either way; nothing of a magnitude that would cost us a $1,522 lead. So that made me a little more open to taking a risk.
    • I don't know how much of a difference winning awards makes, but I assume it's something. We had won Best Ambience during week 1, and had hung on to it up to that point. I didn't want to take the risk that some other shop would improve their ambience, and we wouldn't, and therefore we lose our award.
    • Buying the oven fit our "premium" brand image.
    So we bought the oven.


    I would have written "oven-fresh" instead of
    "delicious", but I didn't want our competition
    to know whether we bought the oven.
    Selling baked goods affects pricing strategy

    With either option, selling baked goods will have an effect on your pricing strategy. In general, you get a greater sales volume with a lower price, but a higher price yields more revenue per cup, so you have to find a sweet spot when you set your price.

    Once you start selling baked goods, you have to factor this additional revenue stream into the picture. After we bought the oven, it made sense to drop our price and attempt to increase our sales volume because the more coffee we sold, the more baked goods we sold. We added this factor to our weekly net income projections.


    Maybe it wasn't worth buying the oven after all!

    Also, as I mentioned in a previous post, boosting our ambience brought in more customers, but we didn't add enough staff to handle that increase. So if you buy the oven, make sure to add servers to accommodate that additional demand.

    Admittedly, I didn't factor the cost of requiring additional staff into my initial baked goods decision projections. It wasn't until after the game was over that I considered--what if you factor in that boosting your coffee sales means that you need to hire an additional server to handle that increased demand on top of the additional server you need to work the oven?

    Two-server difference instead of a one-server difference

    Hmm... When you factor that in, it means it takes a sales boost of over 120 cups per week to make buying the oven worth it.

    Again, there's no way of knowing what kind of sales we would have had if we didn't buy the oven. I don't know how that would have played out in terms of staffing and pricing decisions.

    I will say this, though--the $4,000 outlay does not show up in net income figures. Looking at your competition's numbers, you have no way of knowing for sure whether or not they bought the oven. Your net income figures end up being higher if you buy the oven, because you're making an additional $0.50 in profit per baked good, but it's very hard to discern whether another team bought the oven from looking at all the factors that are visible to you.

    Cumulative net income entering the
    final week. A $4,215 lead, or a
    $215 lead? We couldn't tell.
    What that meant towards the end of the simulation was that I became determined to finish the game with at least a $4,000 lead in cumulative net income. That way, whether or not the second-place team bought the oven, we'd be guaranteed victory. I would have been very annoyed if we finished with a lead in cumulative net income, but lost because we bought the oven and the competition didn't. (Based on the final lead my instructor said we had in terms of cash in the bank, it sounds like they bought the oven.)


    Conclusion

    Buying the oven was a big risk, and fortunately for us, it didn't end up costing us in the end. But, all things considered, it seems like a much safer choice to go with the supplier. 

    Run the numbers, think about what you can afford to do, and ask yourself--how much risk am I comfortable with?


    Brand awareness and advertising strategy

    Final results for Brand Awareness
    In BizCafe, you've started a new business, and people in Collegetown need to find out about it. So you've got to advertise.


    The importance of brand awareness

    The important metric to monitor in this regard is Brand Awareness, which you can find in the results page outside the simulation (and nowhere inside the simulation). This is basically the percentage of people in the market who are aware of your shop. According to winningatbizcafe.blogspot.com, it maxes out at 99.2 or so. They said that brand awareness doesn't deteriorate, but if you look at weeks 7 and 8 in the image above, you'll see that it can, though not by much.

    Essentially, the more people who are aware of your product, the more people will buy your product. Pretty simple. It's better to get it up fast, because if you get it higher sooner, you'll sell more sooner, and it accumulates, which means you'll also sell more later. The greater the portion of the game you spend with a high brand awareness, the more you'll sell.


    Advertising spend strategy

    However, given that you can spend up to $4,200 a week on advertising, it's important to be strategic about it. That's a big chunk of change. Spending too much can seriously eat into your cumulative net income.

    I created a worksheet in my Excel workbook to track changes in brand awareness and plan my ad spend (this is the final version; I adjusted the spend strategy as the game progressed):

    One neat thing that I noticed was that the week-to-week gains seemed fairly consistent. By looking at the weekly changes, you could get a rough idea of what each team was spending.

    At the start, we spent $2,800, and presumably, so did Derosa Coffee House and Cafe Loco, who also had increases in brand awareness of 7.2 points. I'm guessing Java Latte spent the maximum $4,200, which yielded an increase of 10.9. Entering week 2, it looks like Java Latte, Good Brews, and Derosa each spent the maximum $4,200, while Cafe Loco spent less. I was pretty much only concerned with Derosa, our strongest competitor. They kept up their spend going into week 3, and so did we.

    For the starting decisions, it seems like the wise thing to do is to not spend the maximum amount on advertising. We spent $2,800, on online ads and 5 radio spots/day. You're going to lose money during that first week, but you don't want to lose too much. The teams that overspent at the start never caught up. We stepped it up for week 2 because we could afford it; despite spending $4,200 that week, we turned a profit of $880.


    We bought maximum advertising through week 4
    A game of reverse chicken

    It occurred to me fairly early on that advertising spending was going to play out like the reverse of a game of chicken. Someone was going to flinch first, cut back on advertising, and save a ton of money, while the other teams would keep spending, and lose ground in cumulative net income. You want to hang in there, and stay competitive in brand awareness, but not for any longer than the other teams. This is an area of the game where what your competition does makes a big difference.

    If it was a longer game than eight weeks, it would probably be more worth it to drive your brand awareness up to 99, but there would come a point at which the costs of continuing to spend on advertising would outweigh the benefits to be gained from it. If you're not getting a substantial increase in cup sales and revenue, what's the point?


    The flinch

    It came week 4. After we came in first in net income during weeks 2 and 3, Derosa Coffee House out-earned us by $49 during week 4.
    Week 4 results
    We earned more revenue than they did, so they must have spent less than we did. They had 35 employees to our 24, so it wasn't that. I looked at the changes in brand awareness. Ours went up by 19.1 points, while theirs went up by 15.2. I realized that they must have spent $2,800 to our $4,200.

    As far as I was concerned, the endgame had begun. We were entering week 5, and rent was coming out. We needed to cut back. We discontinued the display ads, and cut back to 5 radio spots per day.

    As a result, we pulled way ahead during week 5, earning $2,941 more than Derosa. Despite the added rent expense, we managed a higher net income than during week 4; all the other teams saw their net incomes drop.

    During week 6, Derosa came back and out-earned us again, by $279. We spent $560 on 2 radio spots per day, while they cut back to nothing. If we hadn't bought those radio spots, we would have been on top that week. So that was the end of ad spending for the rest of the way.


    Around the halfway point, sales volumes levelled off
    Sales volumes level off

    I mentioned earlier how it's important to keep an eye on industry-wide growth in cup sales, in addition to watching what your competition is doing. When you see that your ad spend is no longer leading to big gains in sales volume and revenue, it's time to cut back. Continuing to spend big cuts into your profits.


    Coupons

    I didn't bother with coupons, after reading the warning at winningatbizcafe.blogspot.com. Maybe in a longer game, after your brand awareness is maxed out, it might be worth it, but you're basically paying customers to buy your product. Save your money.


    Word of mouth and possibly customer satisfaction

    It would seem that there's some kind of word of mouth factor involved, because our brand awareness still climbed slightly, by about 2 points per week, after we ceased advertising. I have no proof of this, but I wouldn't be surprised if having a good customer satisfaction rating helps out word of mouth. That would explain why each team started out with identical increases in brand awareness at the start, but then had uneven increases subsequently. Again, just a guess on my part.

    Cup size strategy and other incidents

    Special decision entering period 7: Multiple cup sizes
    In our BizCafe simulation, the opportunity to offer small and large cup sizes as well as medium didn't come into play until period 7. (We bought the smallest quantities possible, given how little time was left in the simulation.) Given that our simulation was only 8 periods long, that didn't give me much opportunity to play around with the pricing of the different cup sizes. I managed to learn a lesson pretty quickly, though.


    "Tightly bunched" strategy
    Maxed out customer base?

    Given that we had stopped advertising by this point, my thinking at first was that we were dealing with roughly the same volume of sales as the week before. There must be a minimum difference of twenty cents between the sizes, and I didn't want the lower-margin small cups to cannibalize sales of the higher-margin medium and large sizes. So I thought, let's make the price of a small as unattractive as possible, and let's make the price of a large as attractive as possible. I called it the "tightly bunched" strategy.


    Cup sales with the "tightly bunched" strategy: Not good!
    Strategy backfires

    While we managed to come in first in net income that week, what jumped out at me was that we had a minuscule increase in cup sales that week, while our competition saw substantial gains. It turns out that offering the new sizes expands the market. And our small cup was $0.66 more expensive than the next most expensive competitor's.

    So I decided to go with a more traditional strategy for week 8, and this time I remembered to hire more servers to accommodate the increased demand.


    Much better pricing strategy
    Corrections made

    The results? For the first time all game, we came in first in cups sold. It was the first time in our simulation that a shop came in first in cups sold, revenue, and net income in the same week.

    Our revenue from coffee sales increased by $2,090.90. We sold 369 more small cups than the previous week, which yielded a $1,306.95 increase in revenue. Even our large cups, of which we sold 38 fewer than the previous week, saw a $90.40 increase in revenue. And our medium sales increased as well.

    Cup sales with a 50-cent difference: first place!
    (And hiring two additional servers at an incremental cost of $388.29 led to a reduction in lost revenue of $957.57.)

    The lesson: adding the new cup sizes leads to an increase in overall cup sales, so be sure to accommodate that additional demand for small cups.


    Other special decisions and incidents

    Our final dashboard, and our best period.
    We stuck with our supplier. They were happy about that.
    There are several presentations posted online, mostly on Prezi, in which students have discussed their BizCafe experiences and the lessons they learned. There were things that happened in other versions of the simulation that didn't happen in ours, so I can't comment on them. There were also a few things that happened in our game that I haven't mentioned yet.

    I will say this as a general bit of strategy regarding special decisions and incidents--don't spend money on your shop if there isn't enough time left in the game to recoup the expense.


    Other incidents from our simulation
    • We had the chance to switch suppliers. It came during the last week, and we could have made an extra $100, but I figured it wasn't worth the risk of potentially alienating our regular customers, especially when we already had the award for Best Quality.
    • We had a "problem employee" one week. We fired her. She threatened to sue, but nothing became of it.
    • We came close to running out of medium cups. I was prepared to let them run out. There's no point in buying branded cups in bulk if it's the last round of the game.

    Incidents I read about in other simulations
    • We bought insurance in the starting decisions, and in other simulations, there was a fire. If you didn't buy the insurance, you had to pay for a new espresso machine.
    • You can buy a coffee roaster. Don't know how much it costs. (Only worth it if there's enough time left.)
    • You can install "green" lighting and toilets. Don't know how much it costs. (Only worth it if there's enough time left.)
    • You can change your furniture, or renovate, or something like that.
    • Apparently, you can offer fair trade coffee, and you have the option of lying about serving fair trade coffee. In both versions I read, lying came back to bite them in the ass.
    • You can offer entertainment in your shop to bring in customers. Live music, karaoke, possibly other stuff. I don't know what costs are involved in that.
    • You can pay $500, I think, for a more detailed customer satisfaction survey. Seems like there could be valuable stuff in there, though I managed to ascertain what makes customers satisfied without it. If I had the option and a decent lead, I probably would have spent the $500.
    There could have been more, but that's all I can remember, and I don't feel like researching again.


    Conclusion

    And that's it for our BizCafe experience. Final score after 8 weeks:

    Total revenue: $126,194.40
    Net income: $39,483.50
    Total assets: $64,483.50
    Net increase in cash: $30,255.31
    Final bank balance: $47,639.99